
Prism Energy engaged Nitroxis Technologies to replace ad-hoc spreadsheets and slow, manual reporting with a unified solar power generation analytics platform. Plants and sites were producing valuable telemetry, but insights were trapped in siloed tools and delayed monthly decks. We designed and delivered a MEVN solution—Node.js + Express.js for robust APIs, MongoDB for time-series/telemetry, and a Vue.js dashboard for role-based insights. The platform centralizes data collection, normalizes it for consistency, and surfaces real-time reporting, alerts, and actionable KPIs. Net impact: faster decisions, stronger operational visibility, and a scalable foundation that grows with new assets and data sources.
Challenge
- Disparate spreadsheets and plant-level systems created version drift and rework.
- Manual compilation introduced latency and accuracy risks, delaying decisions.
- Limited, inconsistent visibility across sites, inverters, and strings hindered benchmarking.
- Data growth outpaced legacy tooling, raising scalability and data integrity concerns.
- Security expectations required role-based access, audit-ability, and traceability by design.
In short, leadership needed a single source of truth, operations needed live KPIs, and analysts needed flexible cuts without firefighting CSVs.
Approach
We started with focused discovery — domain modeling with plant managers, operations, and BI stakeholders to align on KPIs, event taxonomies, and reporting cadences. We ran agile sprints with rapid prototypes to validate UX, navigation, and drill-downs early.
Under the hood, we implemented a resilient ingestion → validation → normalization pipeline to standardize telemetry across vendors. The Vue.js dashboards deliver role-based views (Executive, Operations, Analyst), with configurable alerts when performance deviates from expected baselines.
Security and compliance weren’t afterthoughts: API keys/roles, audit trails for critical actions, and environment-segmented observability (logs, metrics, traces). The outcome is a platform that is opinionated where it matters—data quality and access controls—and flexible where it counts—new sites, sensors, and KPIs.
Tech Stack / Architecture
- Frontend (Vue.js): Interactive dashboards, faceted filters, KPI tiles, and exportable reports.
- Backend (Node.js + Express.js): Stateless services exposing REST APIs for ingestion, query, and admin.
- Database (MongoDB): Document + time-series storage for telemetry, events, and report snapshots.
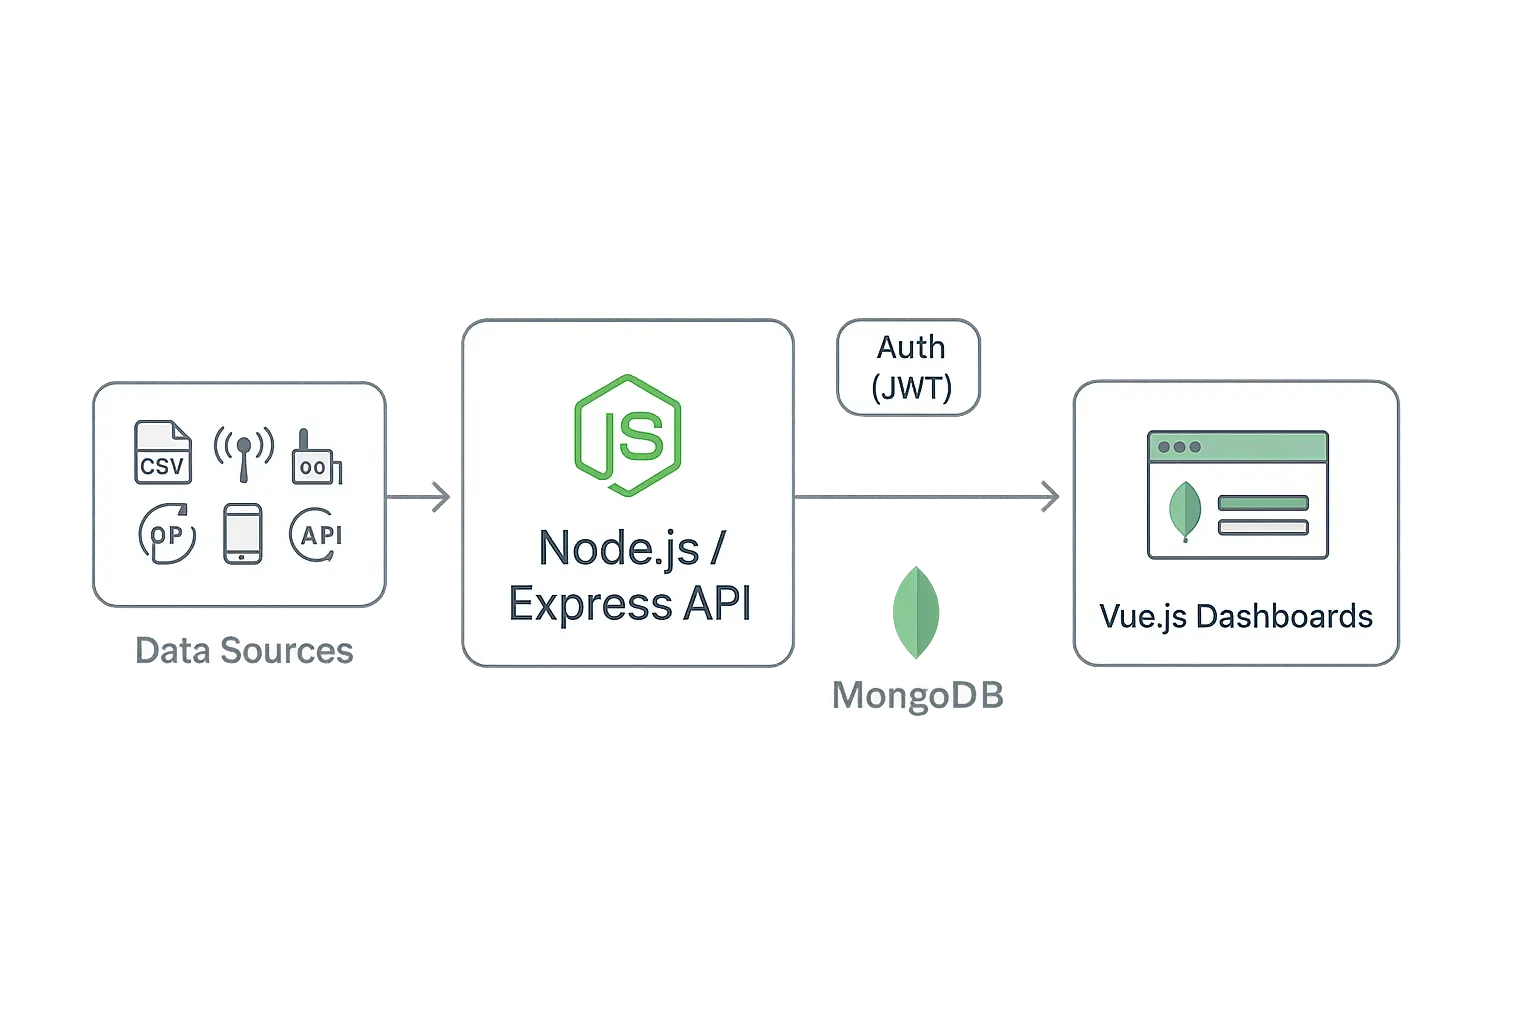
Architecture notes:
- Modular services for ingestion, aggregation, and reporting to isolate blast radius and scale independently.
- API-first design enables downstream integrations (e.g., data lakes, external BI).
- Caching + pagination to keep large dataset queries responsive under load.

Results and KPIs
- Time-to-report reduced from hours to minutes via automated pipelines.
- Data accuracy uplift through validation, deduplication, and schema controls.
- Adoption across client’s installation sites, with tailored role-based dashboards.
- Faster decisions through live KPIs, trend lines, and threshold-based alerts.
- Lower overhead by consolidating tools and eliminating spreadsheet thrash.